14 Sep: Graphing sar Data
sar (from sysstat) is a great built in way to check historic utilisation and saturation for many aspects affecting resources (see also
USE Method). The pure text output isn't always the clearest way to see spikes or correlations between resources. Recent versions of sysstat - 11.4.0 (August 2016) and newer - include native support for converting sar data files to SVG output using "sadf -g":
$ sadf -g /var/log/sa/sa09 -- -n DEV > network-stats.svg
If your version of sar is older, you can copy the sar binary log files to somewhere that does have a new enough version, and generate the SVG charts from there. The sysstat version that generated the logs must be 9.1.6 or newer for this to work (ref.
https://github.com/sysstat/sysstat/issues/135). If the sysstat version is 10.3.1+, you don't need to do anything further. If its between 9.1.6 and 10.3.1 (e.g. EL7) you can convert the format. Otherwise you'll see this message:
$ sadf sa02 -g > cpu-stats.svg
Invalid system activity file: sa02
File created by sar/sadc from sysstat version 10.1.5
Current sysstat version cannot read the format of this file (0x2171)
Convert like this, and you can then use with sadf:
$ sadf -c sa02 > sa02converted
$ sadf -g sa02converted -- -dp > disk-stats.svg
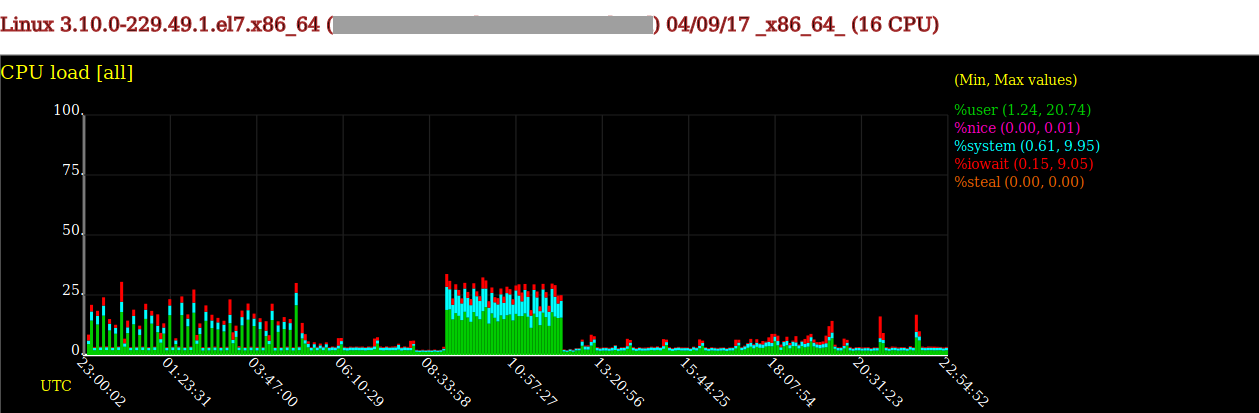
You can view the resulting SVG output in Firefox - the graphs will look something like this: